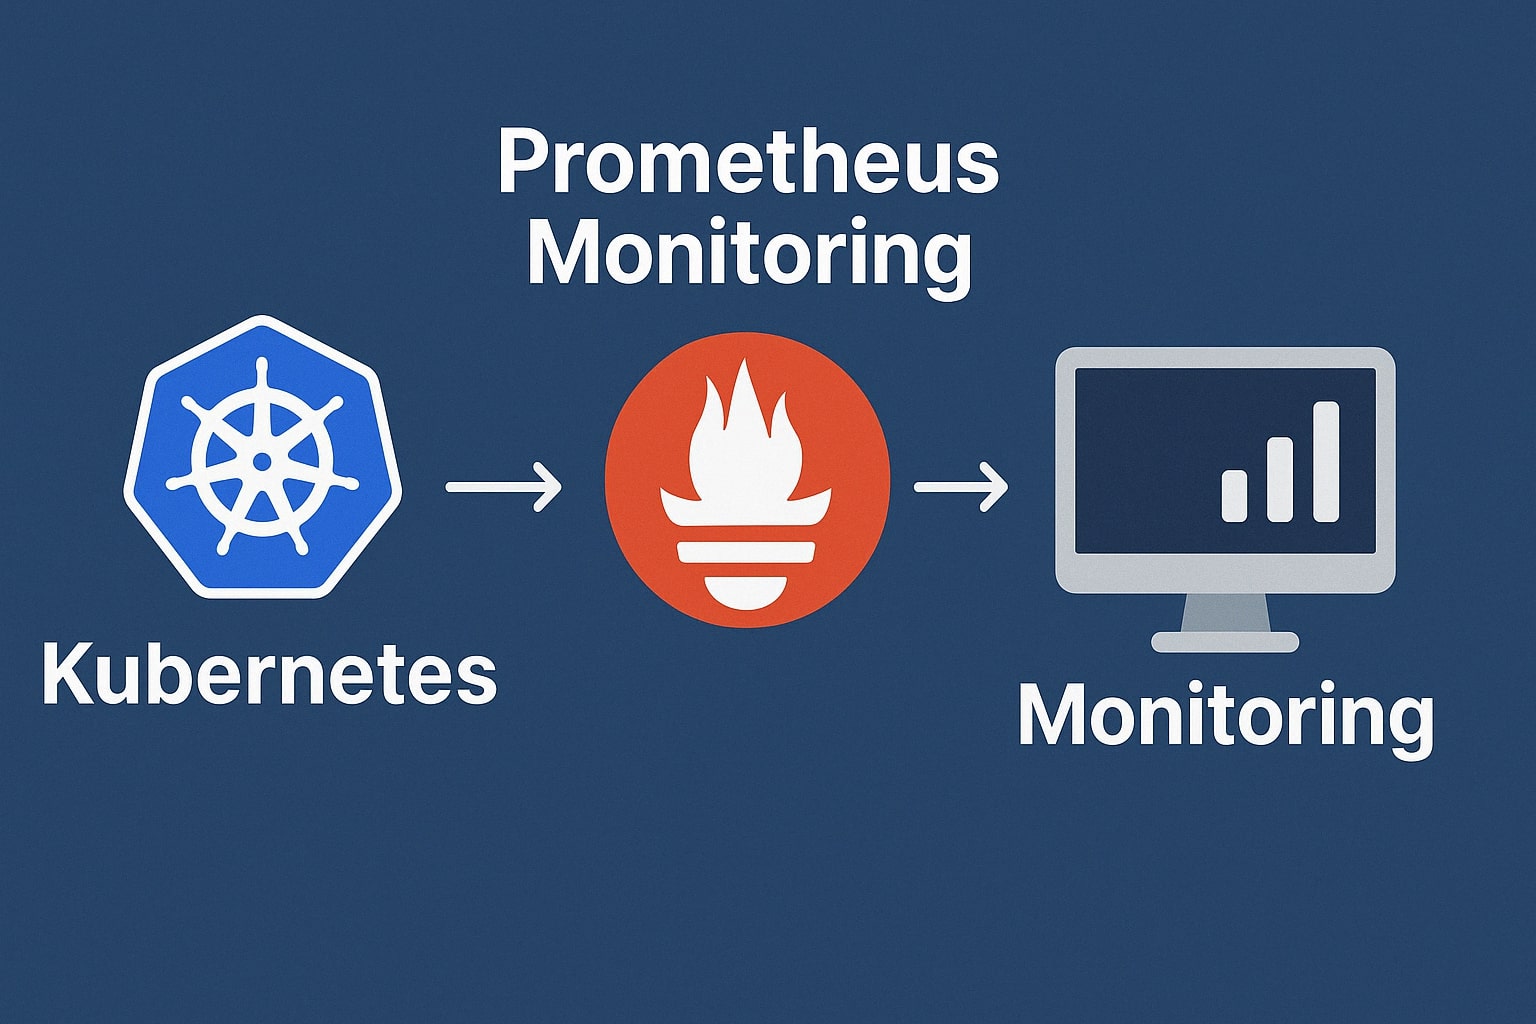
Monitoring Your Kubernetes Cluster with Prometheus and Grafana
In today’s complex Kubernetes environments, having a robust monitoring solution is not just nice to have—it’s essential. This guide will walk you through setting up Prometheus and Grafana to monitor your K3s or any other Kubernetes cluster.
Why Prometheus and Grafana?
- Prometheus: An open-source systems monitoring and alerting toolkit that collects and stores metrics as time series data
- Grafana: A multi-platform open-source analytics and interactive visualization web application that provides charts, graphs, and alerts when connected to supported data sources
Together, they form a powerful monitoring stack that provides insights into your cluster’s health and performance.
Prerequisites
Before we begin, ensure you have:
- A running Kubernetes cluster (this guide uses K3s)
kubectlconfigured to communicate with your cluster- Helm 3 installed
Installation using Helm
The easiest way to install Prometheus and Grafana is using the kube-prometheus-stack Helm chart, which includes:
- Prometheus Operator
- Prometheus instance
- Alertmanager
- Grafana
- Node Exporter
- Kube State Metrics
Let’s create a namespace and install the stack:
# Create a dedicated namespace
kubectl create namespace monitoring

# Add the Prometheus community Helm repository
helm repo add prometheus-community https://prometheus-community.github.io/helm-charts
helm repo update

# Install the kube-prometheus-stack
helm install prometheus prometheus-community/kube-prometheus-stack \
  --namespace monitoring \
  --set grafana.adminPassword=your-strong-password
Replace your-strong-password with a secure password for the Grafana admin user.
Accessing the Dashboards
By default, the services are not exposed outside the cluster. To access them, you can use port-forwarding:
Grafana
kubectl port-forward -n monitoring svc/prometheus-grafana 3000:80Then access Grafana at http://localhost:3000 with username admin and the password you specified during installation.
Prometheus
kubectl port-forward -n monitoring svc/prometheus-operated 9090:9090Access the Prometheus UI at http://localhost:9090.
Setting Up Ingress (Optional)
For production environments, you’ll want to set up proper ingress. Here’s an example using Nginx ingress:
apiVersion: networking.k8s.io/v1
kind: Ingress
metadata:
  name: grafana-ingress
  namespace: monitoring
  annotations:
    kubernetes.io/ingress.class: nginx
    nginx.ingress.kubernetes.io/ssl-redirect: "true"
spec:
  rules:
  - host: grafana.example.com
    http:
      paths:
      - path: /
        pathType: Prefix
        backend:
          service:
            name: prometheus-grafana
            port:
              number: 80
  tls:
  - hosts:
    - grafana.example.com
    secretName: grafana-tls
Apply this with kubectl apply -f ingress.yaml after replacing grafana.example.com with your domain.
Important Dashboards for Kubernetes
Grafana comes with several pre-installed dashboards, but here are some essential ones you should import:
- Kubernetes Cluster Overview (ID: 10856)
- Node Exporter Full (ID: 1860)
- Kubernetes Resource Requests (ID: 13770)
To import a dashboard:
- Go to Grafana UI
- Click on ”+” icon in the sidebar
- Select “Import”
- Enter the dashboard ID
- Click “Load”
- Select the Prometheus data source
- Click “Import”
Setting Up Alerts
Let’s set up a basic alert for node CPU usage:
- In Grafana, go to Alerting > Alert Rules
- Click “New Alert Rule”
- Configure the query:
instance:node_cpu_utilisation:rate5m > 0.8 - Set the condition to:
IS ABOVE 0.8 - Set evaluation interval:
1m - Set “For”:
5m(alert will fire if condition is true for 5 minutes) - Add labels and annotations as needed
- Save the rule
Best Practices
- Resource Limits: Set appropriate resource requests and limits for Prometheus and Grafana
- Retention Period: Configure the retention period based on your storage capacity
- Persistent Storage: Use persistent volumes for Prometheus data
- Federation: For large clusters, consider Prometheus federation
- Custom Metrics: Set up custom metrics for your applications using client libraries
Advanced Configuration
For a production environment, you’ll want to customize the Helm values. Create a values.yaml file:
prometheus:
  prometheusSpec:
    retention: 15d
    resources:
      requests:
        memory: 2Gi
        cpu: 500m
      limits:
        memory: 4Gi
        cpu: 1000m
    storageSpec:
      volumeClaimTemplate:
        spec:
          storageClassName: standard
          accessModes: ["ReadWriteOnce"]
          resources:
            requests:
              storage: 50Gi

grafana:
  persistence:
    enabled: true
    size: 10Gi
  resources:
    requests:
      memory: 256Mi
      cpu: 100m
    limits:
      memory: 512Mi
      cpu: 200m
Then update your Helm release:
helm upgrade prometheus prometheus-community/kube-prometheus-stack \
  --namespace monitoring \
  -f values.yaml
Troubleshooting
Common Issues
- Insufficient Resources: If pods are crashing, check if they have enough resources allocated
- Connectivity Issues: Ensure services can communicate with each other
- Data Retention: If Prometheus is losing data, check the storage configuration
- Target Scraping: If metrics aren’t appearing, check Prometheus targets status
Useful Commands
# Check pod status
kubectl get pods -n monitoring

# Check Prometheus targets
kubectl port-forward -n monitoring svc/prometheus-operated 9090:9090
# Then visit http://localhost:9090/targets

# View Prometheus logs
kubectl logs -n monitoring deploy/prometheus-operator

# View Grafana logs
kubectl logs -n monitoring deploy/prometheus-grafana
Conclusion
You now have a robust monitoring solution for your Kubernetes cluster. With Prometheus collecting metrics and Grafana visualizing them, you’ll have deep insights into your cluster’s performance and health.
In future articles, we’ll explore more advanced topics like custom exporters, alert integrations, and high availability setups for your monitoring stack.